Video Games

Author

Jabir

Leanpub Final Project

Your objectives!

To complete this project there are a few requirements you will need to fulfill. Remember that you are not on your own for this project! Data science is done best as a community, so please ask others (and instructors) questions you have when you get stuck!

  1. Clearly state the data science question and goal for the analysis you are embarking on.

  2. This project should be completely uploaded and up to date on GitHub. Follow the steps in Pushing and Pulling Changes chapter for how to git add, commit, and push the changes you have done.

  3. Follow good organization principles – you should at least have 2 folders: a results folder and a data folder. 4. 4. You should also have a README

  4. Make a resulting plot that you save to a file.

  5. Write up your final observations in regards to your original question. Note that some data science projects end with “This isn’t what I thought it would be” or “that’s strange” or “I think this is leading into another question I would need to investigate”. Whatever your observations may be, write them up in your main R Markdown.

  6. When you feel your analysis is ready for review, send your instructor the GitHub link to your project so they can review it.

  7. Pat yourself on the back for all this work! You are a data scientist!

Data

For this project you will use whatever data you choose.

Options for places to find data are:

  • https://www.kaggle.com/datasets
  • https://shiny.rstudio.com/gallery/tidy-tuesday.html
  • https://stat.ethz.ch/R-manual/R-devel/library/datasets/html/00Index.html (This is the data that comes with R - you can load them using datasets:: and pressing tab in RStudio to see the names of the datasets - for example datasets::ability.cov will load the ability dataset.) You are not limited to these options for finding your data.

<Write where you got your data and provide the link if applicable.>

<Describe how the data was originally created. If this is data that is part of datasets you can use the ? like so: ?datasets::AirPassengers to see information about the datasets.Otherwise provide a summary based on the source of the data.>

The goal of this analysis

<Write here what the goal of this analysis is. What question are we trying to answer?> ## Set up

what new gaming companies are competing against the big gaming companies?

Load packages you will need for this analysis.

## you can add more, or change...these are suggestions
library(tidyverse)
── Attaching core tidyverse packages ──────────────────────── tidyverse 2.0.0 ──
✔ dplyr     1.1.2     ✔ readr     2.1.4
✔ forcats   1.0.0     ✔ stringr   1.5.0
✔ ggplot2   3.4.2     ✔ tibble    3.2.1
✔ lubridate 1.9.2     ✔ tidyr     1.3.0
✔ purrr     1.0.1     
── Conflicts ────────────────────────────────────────── tidyverse_conflicts() ──
✖ dplyr::filter() masks stats::filter()
✖ dplyr::lag()    masks stats::lag()
ℹ Use the conflicted package (<http://conflicted.r-lib.org/>) to force all conflicts to become errors
library(readr)
library(dplyr)
library(ggplot2)
library(tidyr)
library(usethis)

Set up directories

Set up the directories you will need.

if (!dir.exists("data")) {
  dir.create("data")
}
if (!dir.exists("results")) {
  dir.create("results")
}

Get the data

source of data :https://github.com/rfordatascience/tidytuesday/blob/master/data/2021/2021-03-16/readme.md#gamescsv

# Read in your dataset(s)

##source of data :https://github.com/rfordatascience/tidytuesday/blob/master/data/2021/2021-03-16/readme.md#gamescsv

games <- readr::read_csv('https://raw.githubusercontent.com/rfordatascience/tidytuesday/master/data/2021/2021-03-16/games.csv')
Rows: 83631 Columns: 7
── Column specification ────────────────────────────────────────────────────────
Delimiter: ","
chr (3): gamename, month, avg_peak_perc
dbl (4): year, avg, gain, peak

ℹ Use `spec()` to retrieve the full column specification for this data.
ℹ Specify the column types or set `show_col_types = FALSE` to quiet this message.

Explore your data here and describe what variables and samples you have.

glimpse(games)
Rows: 83,631
Columns: 7
$ gamename      <chr> "Counter-Strike: Global Offensive", "Dota 2", "PLAYERUNK…
$ year          <dbl> 2021, 2021, 2021, 2021, 2021, 2021, 2021, 2021, 2021, 20…
$ month         <chr> "February", "February", "February", "February", "Februar…
$ avg           <dbl> 741013.24, 404832.13, 198957.52, 120982.64, 117742.27, 1…
$ gain          <dbl> -2196.42, -27839.52, -2289.67, 49215.90, -24374.98, 1808…
$ peak          <dbl> 1123485, 651615, 447390, 196799, 224276, 133620, 146438,…
$ avg_peak_perc <chr> "65.9567%", "62.1275%", "44.4707%", "61.4752%", "52.4988…

Cleaning the data

games_tidy <- games |> 
  select(gamename,avg,month,year) |>
  top_n(15,year) |>
  arrange(desc(avg)) |>
  filter(gamename %in% c("Counter-Strike: Global Offensive","Dota 2","PLAYERUNKNOWN'S BATTLEGROUNDS","Rust","Apex Legends","Grand Theft Auto V","Team Fortress 2","Cyberpunk 2077","Tom Clancy's Rainbow Six Siege","ARK: Survival Evolved"))


games %>% 
  filter(year == 2021) %>%
  select(gamename,avg,month,year) %>%
  top_n(15,avg) |>
  arrange(desc(avg)) %>%
  filter(gamename %in% c("Counter-Strike: Global Offensive","Dota 2","PLAYERUNKNOWN'S BATTLEGROUNDS","Rust","Apex Legends","Grand Theft Auto V","Team Fortress 2","Cyberpunk 2077","Tom Clancy's Rainbow Six Siege","ARK: Survival Evolved"))
# A tibble: 15 × 4
   gamename                             avg month     year
   <chr>                              <dbl> <chr>    <dbl>
 1 Counter-Strike: Global Offensive 743210. January   2021
 2 Counter-Strike: Global Offensive 741013. February  2021
 3 Dota 2                           432672. January   2021
 4 Dota 2                           404832. February  2021
 5 PLAYERUNKNOWN'S BATTLEGROUNDS    201247. January   2021
 6 PLAYERUNKNOWN'S BATTLEGROUNDS    198958. February  2021
 7 Rust                             142117. January   2021
 8 Apex Legends                     120983. February  2021
 9 Rust                             117742. February  2021
10 Grand Theft Auto V               101251. January   2021
11 Team Fortress 2                  101231. February  2021
12 Grand Theft Auto V                90648. February  2021
13 Team Fortress 2                   83148. January   2021
14 Cyberpunk 2077                    82147. January   2021
15 Tom Clancy's Rainbow Six Siege    77717. January   2021

Plot the data!

##avg means average people that still play that game
games_tidy_plot <- ggplot(data = games_tidy) + 
  geom_point(aes(x = gamename,y = avg,color = gamename)) +  theme(axis.text.x = element_text(angle = 60, hjust = 1))
games_tidy_plot

ggsave("results.png",plot = games_tidy_plot)
Saving 7 x 5 in image

from this plot i can see that counter strike is the top game being played

how long has counter strike been the leading game for?

csgo_data <- games %>% select(gamename,year,avg)

csgo_df <- csgo_data %>% group_by(year) %>% summarise(mean_pop = mean(avg))

ggplot(data =csgo_data,aes(year,avg)) + geom_line()

i want to compare counter strike from 2012 to 2021 to all games

comp_df <- games %>% group_by(year) %>% filter(all(2012:2021)) %>% summarise(mean_pop = mean(avg))

cscom_plot <- bind_rows(list(csgo = csgo_df,all_other_games = comp_df),.id = "game")

csgo_plot <- ggplot(cscom_plot,aes(year,mean_pop,color = game)) + geom_point() + geom_smooth()

ggsave("csgo_plot.png",plot = csgo_plot)
Saving 7 x 5 in image
`geom_smooth()` using method = 'loess' and formula = 'y ~ x'
ggplot(cscom_plot,aes(year,mean_pop,color = game)) + geom_point() + geom_smooth()
`geom_smooth()` using method = 'loess' and formula = 'y ~ x'

this plot didn’t really tell me the impact so

now i want to compare csgo to games like grand theft auto and dota 2, which were very popular games over the years

game_comparison <- games %>% filter(gamename %in% c("Counter-Strike: Global Offensive","Dota 2","Grand Theft Auto V")) %>% select(gamename,year,avg)

games_plot <- ggplot(game_comparison,aes(year,avg,color = gamename)) + geom_smooth()

ggplot(game_comparison,aes(year,avg,color = gamename)) + geom_smooth()
`geom_smooth()` using method = 'loess' and formula = 'y ~ x'

ggsave("games_plot.png",plot = games_plot)
Saving 7 x 5 in image
`geom_smooth()` using method = 'loess' and formula = 'y ~ x'

Get the stats

Conclusion

Write up your thoughts about this data science project here and answer the following questions:

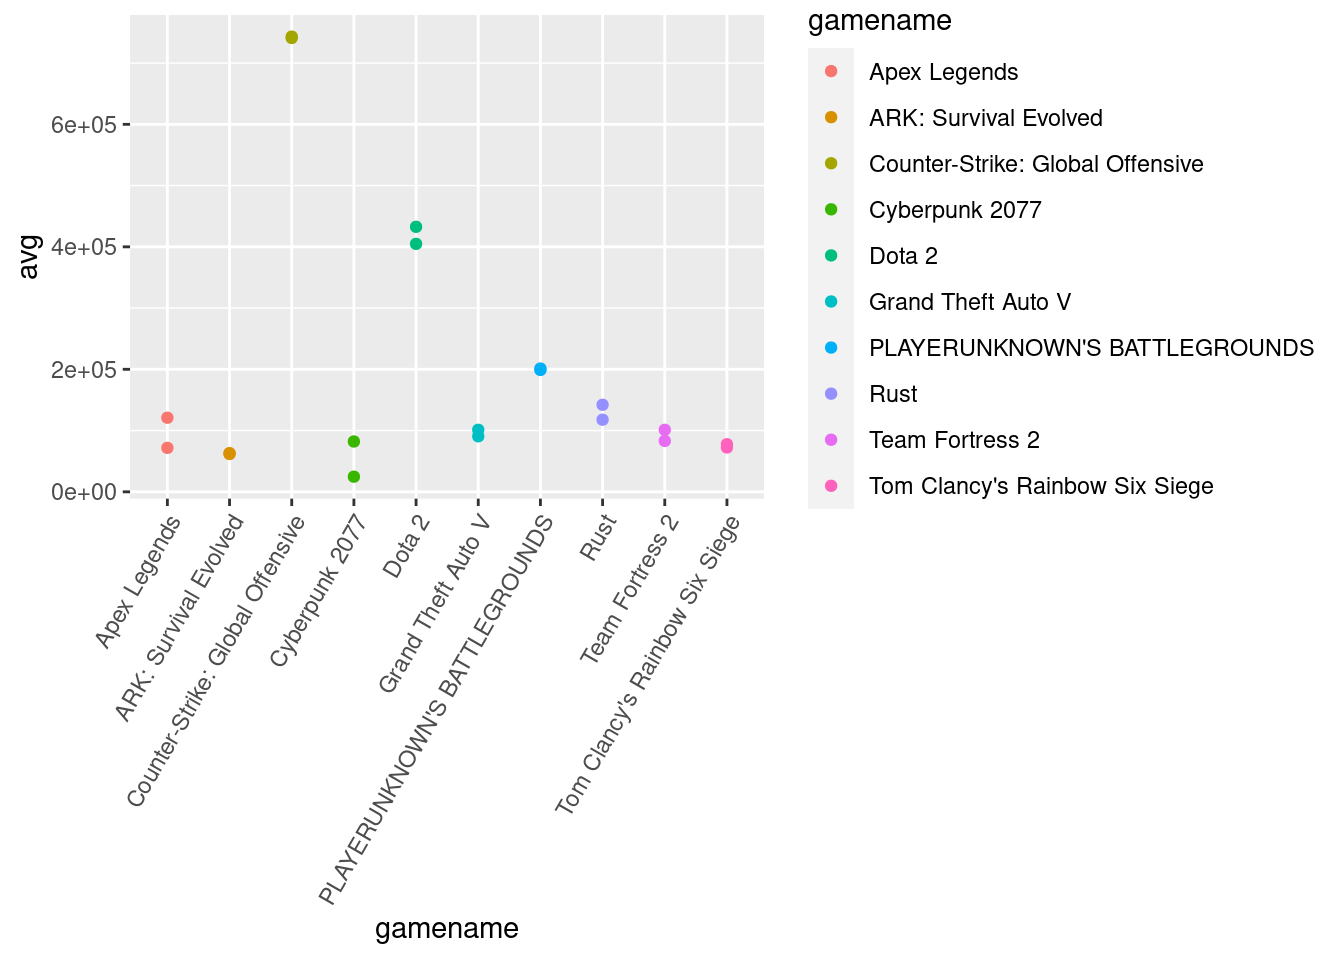
i can tell from this plot that games like apex legends,ark survival evolved,team fortress 2,cyberpunk 2077 are runners ups comparing them to the main companies like counter strike,grand theft auto,rainbow six siege and rust in the earlier part of 2021 from steams data.

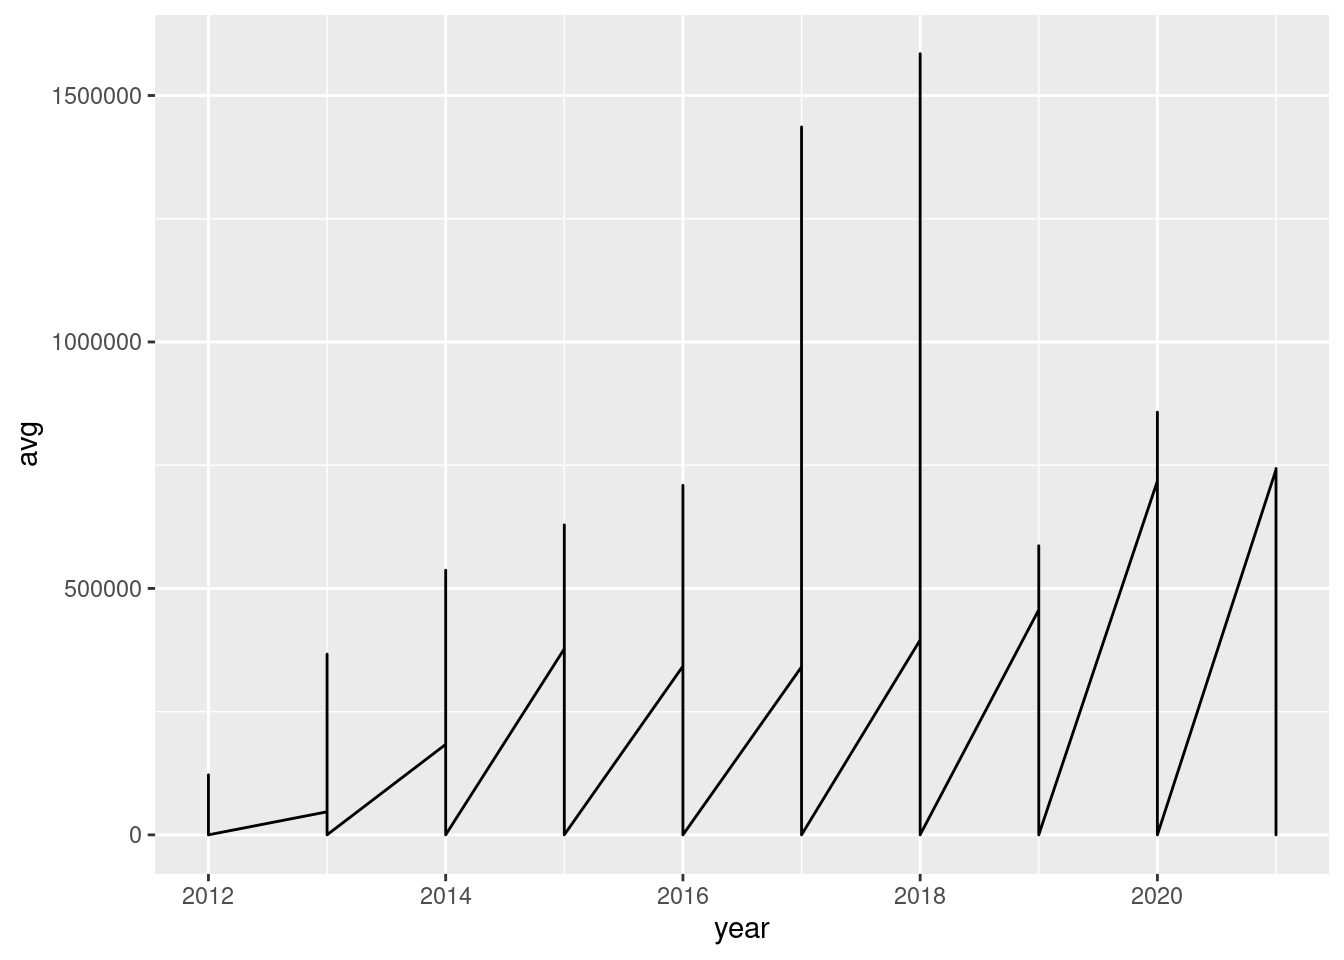
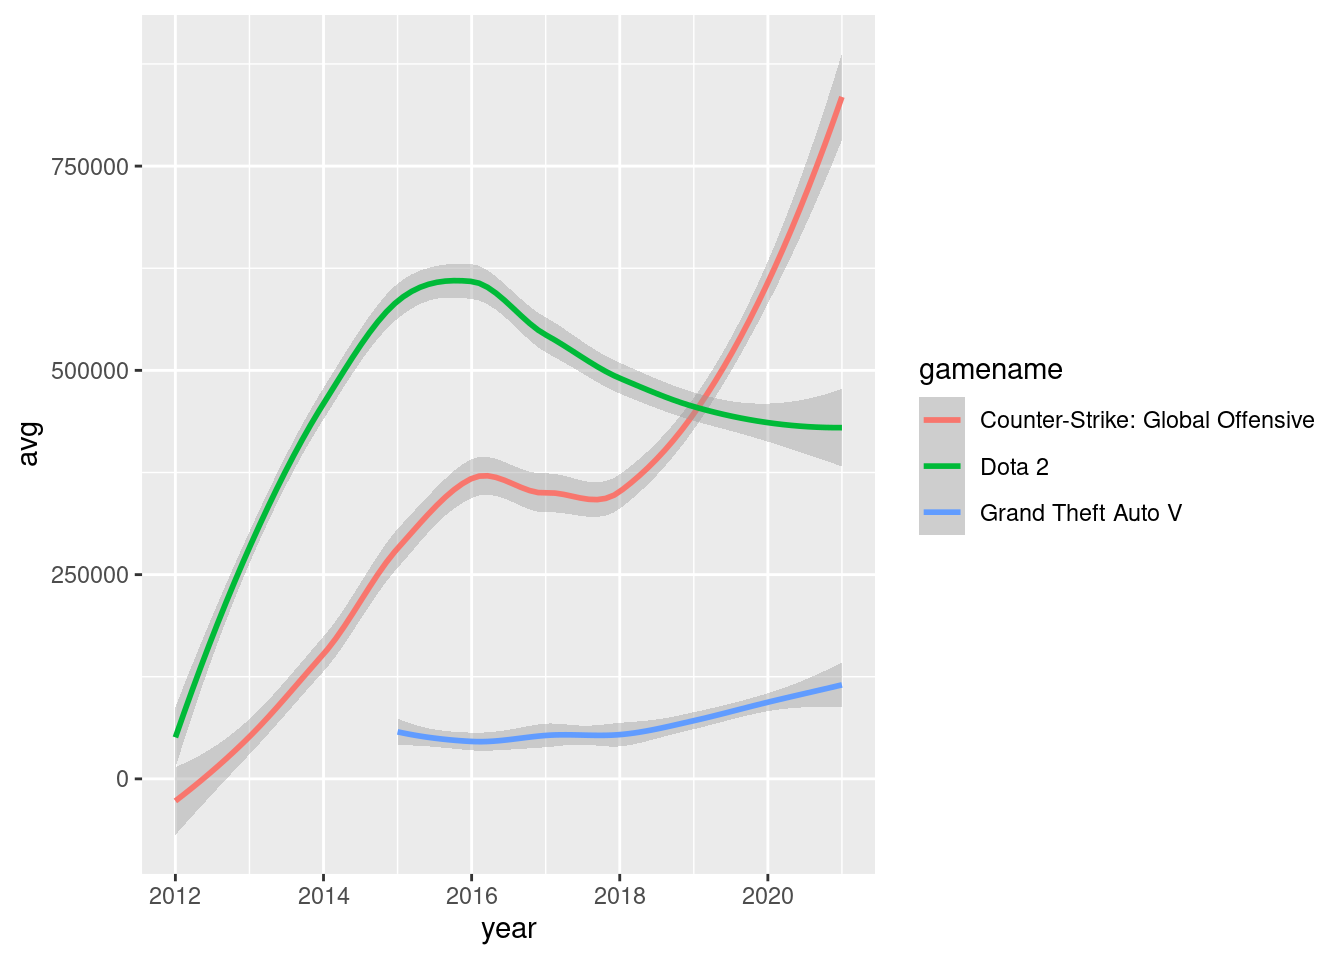
also i found that counter strike averaged way more players over the years than other games

the company names of the big companies are

-counter strike = Valve

-dota 2 = also Valve

-grand theft auto = Rockstar

-rust = facepunch

-rainbow six siege = ubisoft

Runner up companies

-apex legends = Respawn Entertainment

-team forttress 2 = Valve

-ark survival evolved = Studio Wildcard

-cyberpunk 2077 = CD Projekt Red

  • What did you find out in regards to your original question?

that the big companies could own alot more than i thought,the runner ups have been making waves in the gaming community

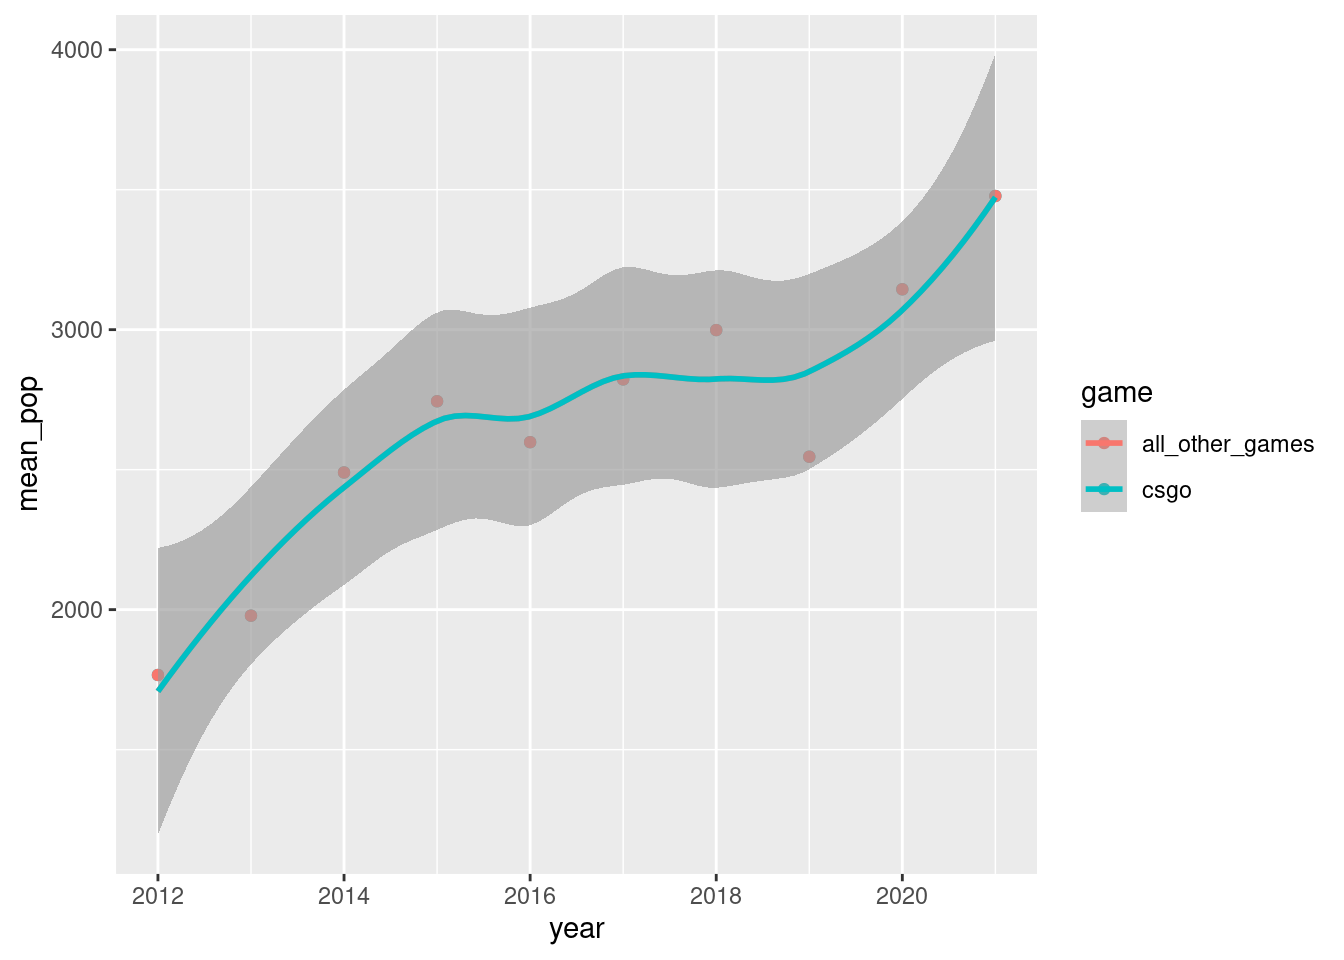
csgo has only been the leading game in players sense 2019

  • What exceptions or caveats do you have in regards to your analysis you did?

that this data is only part of a small portion of 2021, and this is data only from a website called steam

that this data is not current data

  • What follow up questions do you have?

i wonder what games are peaking right now on the charts, i also wonder if some of these games are still pulling that many people